

Milestones to Understanding Global Warming
Milestones to Understanding
Global Warming
Late 1700's
Industrial Age Begins
The change from an agrarian and handcraft economy to one dominated by industry and machine manufacturing begins in Britain and later spreads to other parts of the world.
An ever growing artifact of the period is the emission of CO2 from burning coal and other fossil fuels.
1824
Natural
Greenhouse Effect Discovered
French mathematician & physicist Joseph Fourier
discovers what is now called the greenhouse effect when investigating why, considering solar radiation only, Earth is warmer than expected.
1859
Natural Greenhouse Effect Proven
John Tyndall, an Irish physicist, correctly measures the heat absorbed by the different gasses which make up Earth's atmosphere and proves that the natural greenhouse effect exists.
1896
Human-CausedGreenhouse Effect Predicted
Svante Arrhenius, a Swedish physicist & physical chemist, predicts human-caused CO2 emissions are large enough to cause global warming.
He calculated that
doubling CO2 in the atmosphere would cause temperatures to rise 3 - 4 °C.
1958
Human-Caused
Greenhouse Effect Measured
Charles David Keeling, an American climate scientist, begins measuring atmospheric CO2 at the base of a volcano in Hawaii. His measurements become a true measure of the global carbon cycle and provide the first evidence that human activity is negatively affecting the climate.
1988
Awareness of Global Warming Grows
James Hansen, an American senior scientist for NASA, testifies before the US Senate
that the greenhouse effect has been detected and is already changing the climate.
IPCC Founded as Mechanism for International Scientific Consensus
The United Nations Environmental Programme (UNEP) and the World Meteorological Organization (WMO) form the Intergovernmental Panel on Climate Change
(IPCC) to provide global policy leaders with regular assessments of the scientific basis of climate change, its impacts and future risks, and options for adaptation and mitigation.
Currently there are 195 countries participating with hundreds of expert authors and thousands of reviewers contributing to each IPCC Assessment Report.
1990
IPCC First Assessment Report (FAR)
The IPCC releases it's first assessment reflecting the work of several hundred scientists from 25 countries. The report represents the most strongly scientifically supported statement on climate change of the time.
Some of the key findings from the first assessment are:
- A natural greenhouse effect exists which already keeps the Earth warmer than it would otherwise be.
- Human activities are substantially increasing the amount of greenhouse gasses in the atmosphere.
- The increased amount of greenhouse gasses is causing the earth to warm.
- The Earth's temperature has already increased by 0.3 - 0.6 °C and its sea-level has already risen by 10 - 20 cm.

353 ppm

4 °C

65 cm
1995
IPCC Second Assessment Report (SAR)
The global scientific consensus of the second assessment continues the precedence of the first with 78 lead authors, 400 contributing authors representing 26 countries and over 500 reviewers from 40 countries.
Some of the key findings from the second IPCC report are:
- Greenhouse gasses (CO2, CH4, N20) have been increasing since 1750 and are causing climate to change.
- CO2 and N20 remain in the atmosphere for very long times and will have warming effect for centuries.
- Increases in greenhouse gasses are primarily attributed to fossil fuel use, land use changes and agriculture.
- The Earth's temperature has increased by 0.3 - 0.6 °C and sea-levels have risen by 10 - 25 cm.
358 ppm
1.0 - 5.1°C
22 - 118 cm
2001
IPCC Third Assessment Report (TAR)
The third IPCC assessment, developed by 122 lead authors, 515 contributing authors and 420 reviewers concludes:
- It is unequivocal that Earth's climate is changing.
- Most of the observed warming is attributable to human activities.
- Observed changes in sea level, ice and snow cover, growing seasons and plant and animal ranges are further evidence of climate change.
- Climate change threatens human health, particularly in lower income populations.
- It is more effective to address climate change as part of strategy to address sustainable development.
- The Earth's temperature has increased by 0.4 - 0.8 °C and sea-levels have risen by 10 - 20 cm.
368 ppm
1.7 - 6.5 °C
19 - 108 cm
2007
IPCC Fourth Assessment Report (AR4)
The fourth report reflects the work of over 500 lead authors and 2000 expert reviewers. Some of the key findings from the fourth IPCC report are:
- Warming of the climate system is unequivocal.
- Sea-level rise is accelerating.
- All continents and most oceans are being effected.
- CO2 concentration is highest in 650,000 years.
- Most of increase is due to human caused greenhouse gasses.
- Impacts to water, ecosystems, food production, coastline and health are predicted.
- Warming & sea level rise will continue for centuries due to greenhouse gasses already emitted into atmosphere.
- Earth's temperature has increased 0.8 - 1.1 °C and sea levels have increased by 14 - 24 cm.
379 ppm
2.0 - 6.3 °C
34 - 71 cm
2014
IPCC Fifth Assessment Report (AR5)
The Fifth Assessment Report puts greater emphasis on assessing the socio-economic aspects of climate change and its implications for sustainable development.
Reflecting contributions from over 830 authors and review editors from over 80 countries, some of the key findings from the fifth IPCC report are:
- Human influence on climate system is clear with widespread impact on every continent and every ocean.
- Human caused atmospheric concentrations of carbon dioxide, methane and nitrous oxide are unprecedented in at least the last 800,000 years.
- Changes in extreme weather events are observed since around 1950.
- The more we disrupt our climate, the more we risk severe, pervasive and irreversible impacts.
- We have the means to limit change.
- The average global surface temperature has increased by 0.7 to 1.1 °C and sea levels have increased 17 - 25 cm.
391 ppm
0.3 - 4.8 °C
26 - 82 cm
2015
The World Unites to Address Causes & Consequences of Climate Change
The landmark Paris Agreement
brings all nations into a common cause to combat climate change and adapt to its effects.
With the last hold-outs - Syria and Nicaragua - eventually signing on, the agreement is signed by every country in the world with the caveat that President Trump has initiated measures to withdraw the USA.
The primary objectives of the agreement are:
- Keep global temperature rise well below 2 °C above pre-industrial levels.
- Pursue efforts to limit the temperature increase even further to 1.5 °C.
- Increase the ability of countries to deal with the impacts of climate change.
- Align global financial incentives to be consistent with low GHG emissions and climate-resilient pathways.
Within the agreement, each country set it's own targets.
Paris Agreement Greenhouse Gas Reduction Pledges for Selected Countries
China
60- 65% per unit of GDP
USA
26 - 28%
EU
>40%
India
33-35% emission intensity
Brazil
43%
Russia
25-30%
Japan
26%
Canada
30%
Iran
4-12%
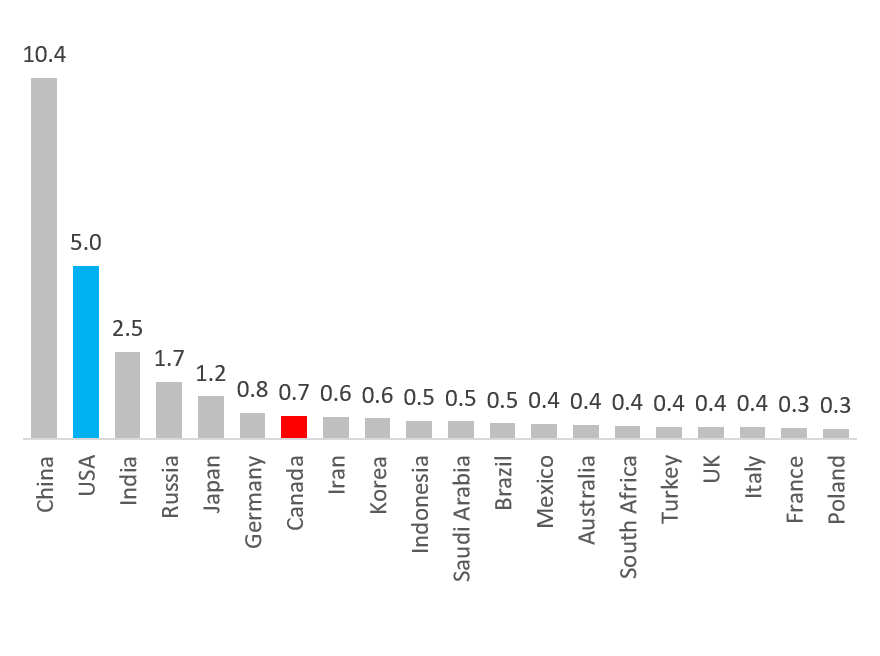
2016 Top 20 Annual C02 Emissions by Country
Total
(Gtons CO2)
Per Capita
(tons CO2)

Protellus provides complete online marketing solutions to help small businesses leap from struggle to stride.
© 2020 Protellus. All rights reserved.